Which Vegetation Index Should I Use?
March 10, 2023
Vegetation indices are valuable precision agriculture tools to assess crop health, yield potential, and other variables that drive informed farm management decisions. Choosing the right vegetation index is vital for accurate results but depends upon camera hardware, environmental conditions, crop type and growth stage. Understanding the underlying strengths and limitations of common indices will help you choose the best one for your operation.
Light powers vision. Every object we see is a reflection of light waves from the electromagnetic spectrum. Visible wavelengths appear to us as colors, but other light wavelengths can only be detected by cameras or specialized sensors from satellites, drones, or ground-based devices.
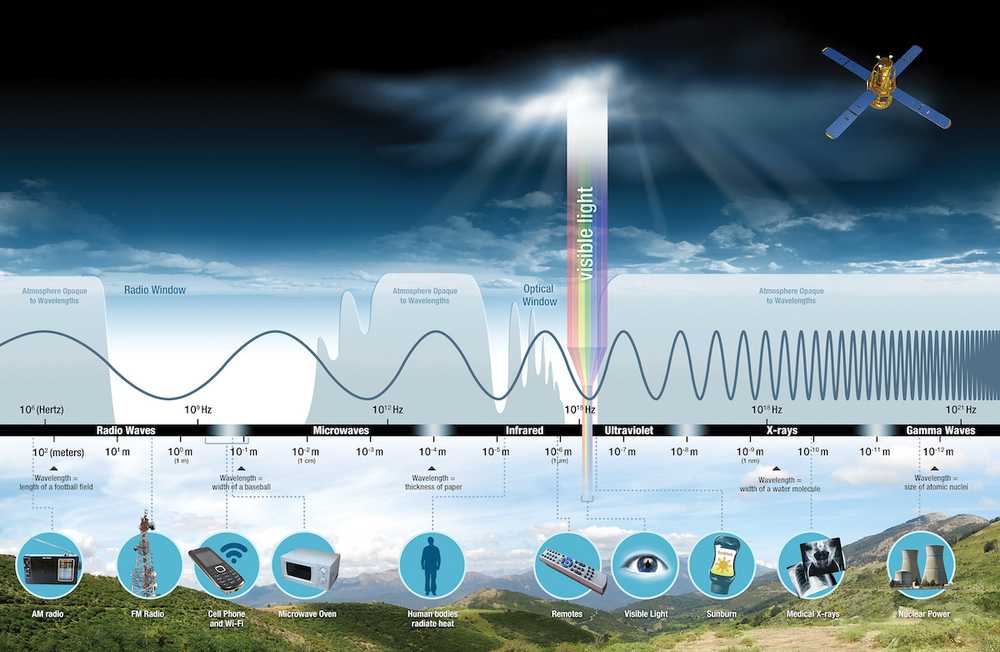
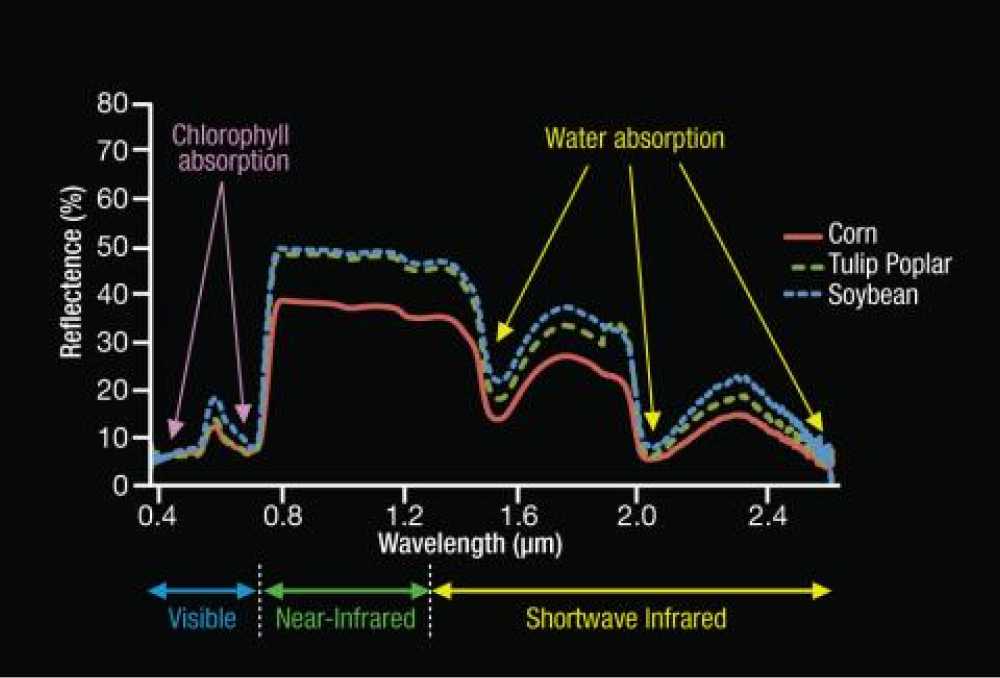
Plant leaves absorb certain light wave bands for photosynthesis, but they also reflect light based on their physical condition and development. Leaf chlorophylls absorb most blue and red light and reflect higher levels of green, which is the color we view plants.
But a leaf’s reflectance (and the underlying information) increases dramatically in the red-edge or near-infrared spectrum. Infrared short waves are absorbed by water and poorly reflected. Reflectance for a canopy of leaves is different than a single leaf due to the volume and orientation of the leaves as well as light transmission to lower plant leaves.
In precision agriculture, these nuances can be measured and monitored as a vegetation index that can reveal a plant’s health, needs, stressors, and even production potential.
What is a Vegetation Index?
A vegetation index is a math formula comparing the amounts of absorbed and reflected light from different bands. Drone images capture and render this reflectance data as individual pixels in your field image.
That’s why image resolution is important! Each pixel in a low-resolution image might represent several meters on the ground obscuring plant-level information and including non-crop areas like tramlines which distort index values. High-resolution image pixels can be small enough to cover an entire leaf of each plant, providing far more detailed crop information.
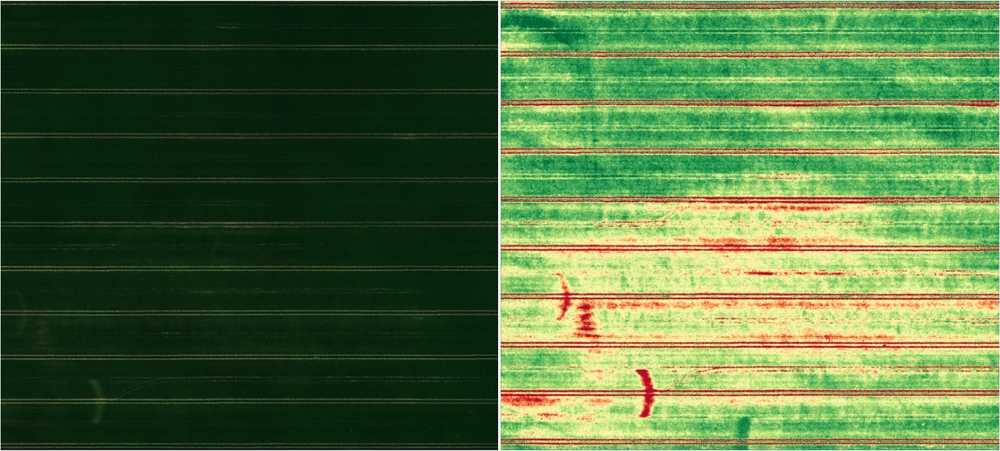
In a field image, each pixel is assigned an index “score,” usually a number from -1 to +1. High values usually signify healthier plants and low values represent inorganic or dead material. Together, all the image’s data points produce a gradient of crop performance across the field.
Once the index values are generated for each pixel in the image, it is common to assign colors (usually the stoplight palette of red, yellow, and green) so that the plant variation values can be easily visualized and interpreted. It essentially renders a bird’s-eye health map of a crop field.
For example, NDVI outputs range from -1 to 1. Because NDVI measures a plant’s greenness, any value below 0 represents a dead plant or inorganic object (usually color mapped as red).
Why Are There So Many Vegetation Indices?
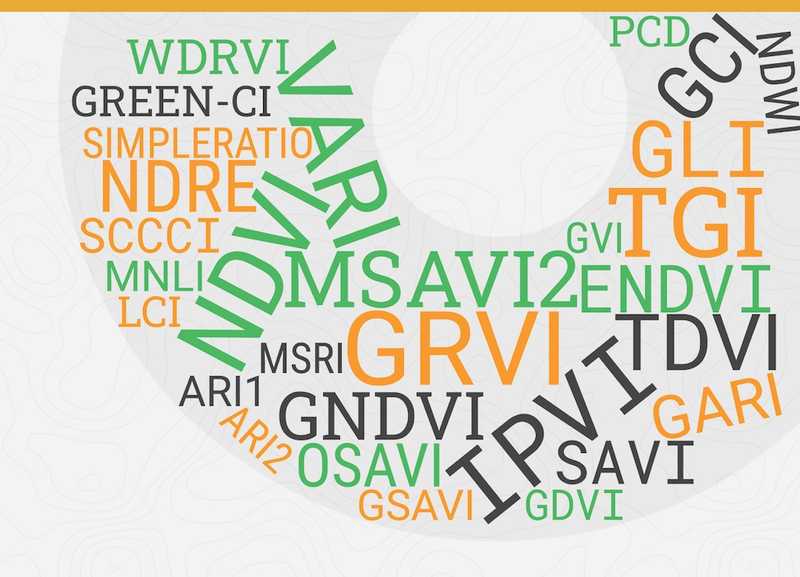
NDVI was developed in 1973, but there are many other vegetation indices available. The IDB index database lists 66 vegetation indices, and the Sentinel 2 satellite produces over 130 relevant to vegetation!
Because of the number of light, environmental and biological variables in agriculture, researchers have developed vegetation indices for many different purposes. Some indices isolate extremely narrow light bands, some filter in or out soil and atmospheric effects, and others evaluate different crop features.
How do you know which to use? Your choice of vegetation index should be crop and intent-driven, but the data you can collect ultimately depends on your hardware.
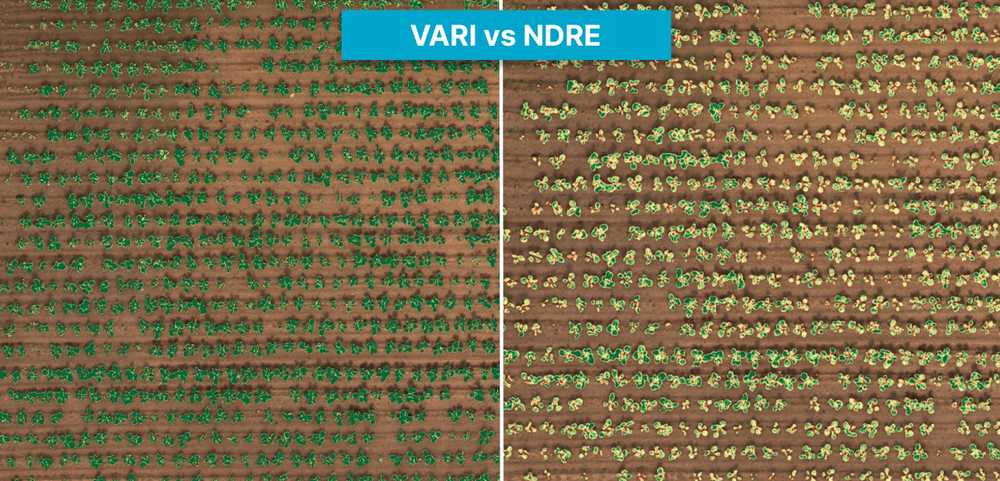
RGB sensors only render vegetation indices (like VARI or GLI) from visible light – basically what your eye registers, but with minute variations. Multispectral sensors offer a multitude of vegetation index options from invisible infrared wavelengths, helping to reveal patterns not visible to the human eye.
Download The Complete UAV Handbook for Agricultural Research
Learn how to establish a successful drone imaging program without a data scientist
Get your free pdfRGB Vegetation Indices
The visible light bands (red, green, and blue) provide information on leaf pigmentation or how green a plant is. Since chlorophyll production indicates plant health or vigor, an RGB vegetation index is useful in assessing the crop’s growth stage and general crop health.
Commonly used RGB Vegetation Indices
- GRVI (Green Red Vegetation Index)
- VARI (Visible Atmospheric Resistance Index)
- GLI (Green Leaf Index)
- TGI (Triangular Greenness Index)
Multispectral Vegetation Indices
Multispectral sensors can capture red-edge, near-infrared and short-wave infrared light that, while invisible to us, provides valuable plant information on chlorophyll concentration, cell structure, water content and biochemical components.
This information can be useful to evaluate plant health, for early disease and pest damage, and to assess or predict plant productivity.
Commonly used multispectral vegetation indices
- NDVI (Normalized Difference Vegetation Index including red-edge)
- NDRE (Normalized Difference Red Edge)
- SAVI/MSAVI (Modified Soil Adjusted Vegetation Index)
- EVI (Enhanced Vegetation Index)
- LAI (Leaf Area Index)
- NDWI (Water Index)
- CHI (Chlorophyll Index)
Vegetation Index Limitations
While vegetation indices are extremely useful in quickly evaluating a full field or revealing imperceptible cues, it’s important to remember that they are mathematical measurements.
Indication, Not Causation
Vegetation indices can guide troubleshooting, but they don’t directly diagnose problems, even when plants share the same symptoms. Plants in the same field can show stress from potentially different causes like drought, disease, pests, etc.
Ground-truthing will always be necessary, but vegetation index maps are invaluable for pinpointing locations for deeper investigation.
Comparing Measurements
Because the sun’s height and light intensity vary depending on the cloud conditions, and at different locations and times of the year, radiometric sensor calibration is essential to compare data between locations or at different points in time. Without calibration, data could significantly skew comparisons and conclusions.
How to Choose Which Vegetation Index to Use
Beyond your hardware setup, there are several considerations to guide your choice of vegetation index.
- Crop type: plant architecture and biomass
- Growth stage: exposed soil, leaf area, physical changes (flowering, senescence)
- Agronomic interest or goal: plant health, disease detection, water stress, nutrient management, yield estimation
Common Vegetation Indices and Best Practices
Researchers are constantly testing and evaluating vegetation indices for different crops. There aren’t any hard and fast rules. So, you may have to do some experimenting yourself. But there are some common applications that can narrow the field.
Assessing A Crop’s Physical State
Understanding a field crop’s current condition (visible or not) is extremely valuable to staying ahead of problems or diagnosing them quickly. Minute changes in water stress, leaf color or biomass can be early clues of trouble that require closer investigation.
NDVI (Normalized Difference Vegetation Index)
The industry standard, especially for crop nitrogen status. It combines visible and NIR bands and is a good mid-season measure of plant health and biomass. Often used for grain yield prediction in mid-growth stages (before heads fill). It tends to ‘saturate’ or obscure subtle variations, especially in late-stage crops.SAVI/MSAVI (Modified Soil Adjusted Vegetation Index)
Accounts for soil reflectance and is useful for early growth stages or crops with exposed ground like tree orchards or vineyards. Can be useful to identify emergence hotspots while replant decisions are still viable.EVI (Enhanced Vegetation Index)
Used to gauge plant health and water stress, especially for crops with high canopy density where NDVI conceals small variations.LAI (Leaf Area Index)
Used to measure the amount of leaf area in a given area of land. It can be useful to track plant growth over time or as an indicator of plant productivity since more leaves mean more photosynthesis. Potentially useful for yield prediction.NDWI (Normalized Difference Water Index)
Measures the amount of water in vegetation. It is used to assess water stress in plants, as well as to identify areas with high water content in vegetation. Useful for assessing drought stress and irrigation or storm ponding.
Evaluating & Predicting Crop Productivity
Crop nutrient management and yield prediction are two topics of great interest and agricultural research. The most frequently studied vegetation index is NDVI, followed by LAI and EVI. NDVI and LAI study has increased in recent years.
CHI (Chlorophyll Index)
Used to assess the amount of chlorophyll in vegetation, which is important for understanding plant health and productivity. It can be indicative of nutrient requirements and yield prediction. It can also be used to identify areas of excessive chlorophyll content, which could signal water stress.TGI (Triangular Greenness Index)
Most indices measuring chlorophyll content use red-edge light bands which are not collected by RGB sensors. TGI is often used to measure and manage plant nitrogen needs when multispectral sensors aren’t an option. It assesses plant chlorophyll without the effect of leaf area.NDRE (Normalized Difference Red Edge)
Measure the amount of chlorophyll in plant leaves. NDRE is often used to assess nitrogen stress independent of the amount of soil nitrogen. Because the light bands used in this index penetrate the lower canopy of plants, it is often used to assess mid and late-stage crops. Often used to create variable rate nutrient application maps.
Benefits of Vegetation Indices from Drones
Vegetation indices can be calculated from drone or satellite sensors. But drones offer some unique benefits.
- Increased resolution – Drones can take images with much higher resolution than satellites, important for crops with small leaves, micro plot research, or highly detailed inquiries.
- Faster data acquisition – Drones can collect data faster and with more flexibility than satellites. This allows pilots to account for weather or specific crop stage timing.
- Improved accuracy – Because drones fly low to the ground, they are less affected by atmospheric influences than satellite data. Some vegetation indices attempt to correct for these effects, but drones experience less visual variability.
- Hardware flexibility - Drones or sensors can be changed or updated as needed by pilots.
- Convenience - Drone flights can be scheduled or repeated as needed to capture data at different times or locations.
Solvi Simplifies Agricultural Drone Imagery
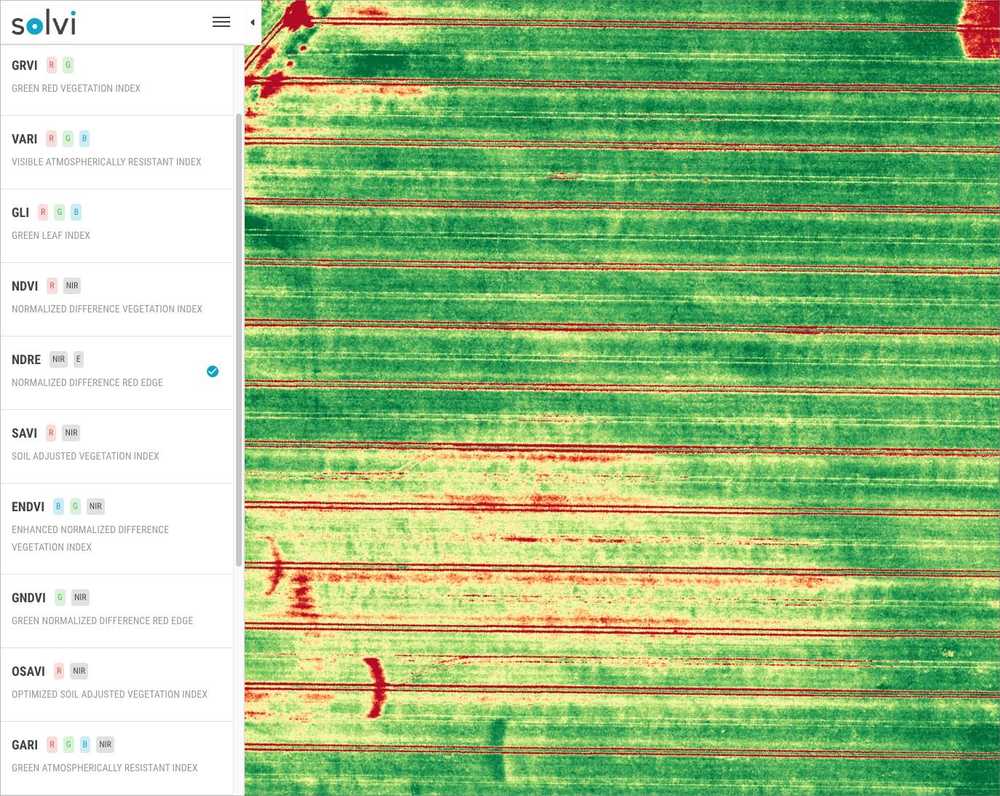
Drones can deliver insightful crop data like vegetation indices across research plots or entire fields fast. Every Solvi account includes access to predefined industry standard indices like VARI, GRVI, GLI, NDVI, NDRE, OSAVI and more. Agronomist and Enterprise-level users can even add virtually any vegetation index or even define their own formula.
Best of all, generating a vegetation index map in Solvi is a few simple clicks. No writing (or remembering) complicated formulas!
Drone data should enhance your agricultural operation, not monopolize your time. If back-end processing has become the achilles heel of your imagery program, we can help.
Solvi simplifies agricultural drone imagery analytics so growers and researchers can focus on crops - not coding.
But simple doesn’t mean shallow. Our cloud-based analytics platform lets you dive deep into crop analytics with accurate plant counts and sizing, vegetation indices for plant health, biomass, fertility response, plant stress, and more.
Solvi is your one-stop for agricultural drone image stitching, analysis, and reporting for superior crop insights. Try your field imagery in Solvi for free today
Want more technical information about vegetation indices? See what the agricultural experts have found in their crop research.
