How to Process and Optimize Quality of Multispectral Imagery from MicaSense Sensors
April 20, 2022
Multispectral drone imagery has quickly become an invaluable tool to agricultural researchers and plant breeders around the world. Previously imperceptible revelations from this data-laden imagery are accelerating the evolution of agronomic management and plant breeding.
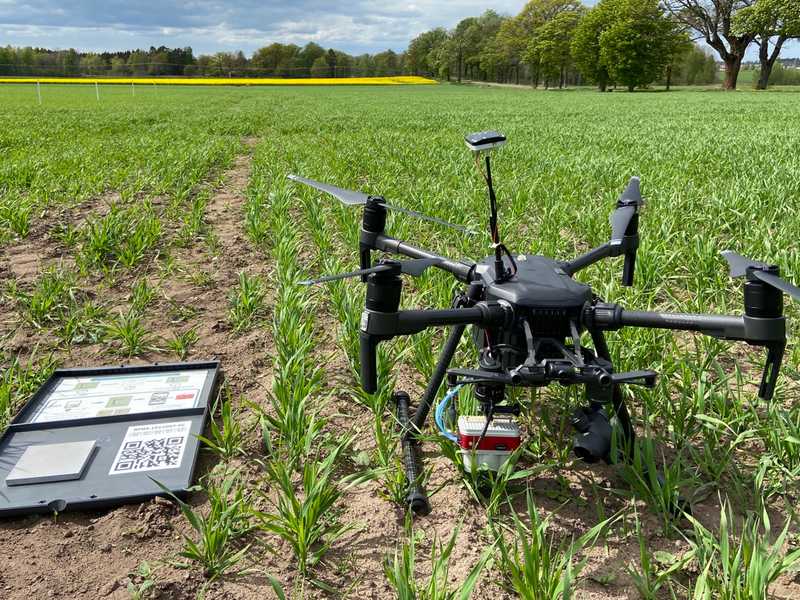
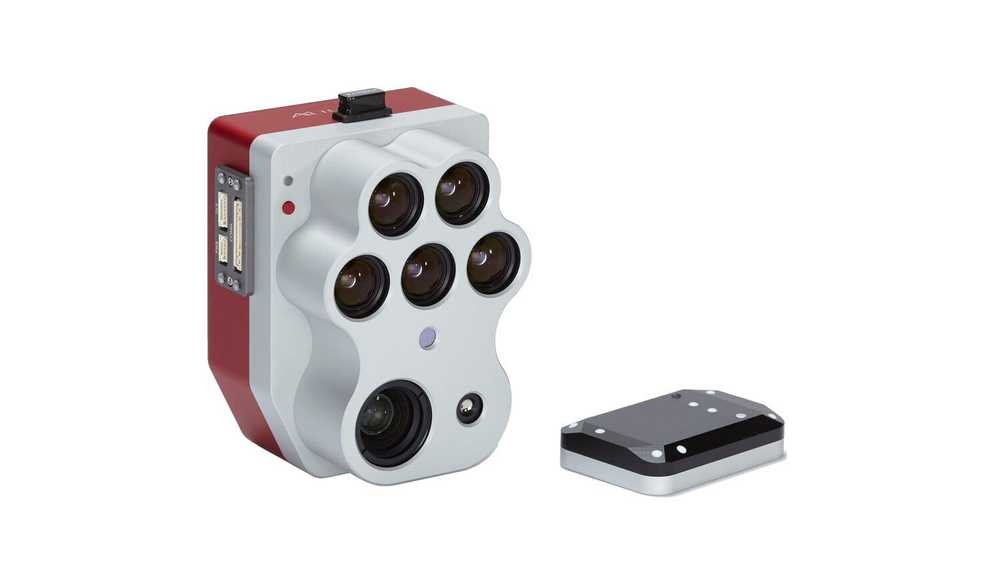
With multispectral sensors like MicaSense’s RedEdge and Altum, researchers can quickly collect high-resolution field imagery, capturing not only the visual red, green, and blue (RGB) light bands but also near-infrared and red-edge bands that can help analyze noteworthy traits and responses in crop research.
5 Factors Influencing Multispectral Data Quality
While multispectral sensors’ data-rich images offer dramatic, invisible insights, they come with complex caveats. Several underlying factors can make or break your data accuracy and quality.
Here are 5 factors that influence multispectral drone data quality. Understanding and addressing these challenges will ensure the most accurate datasets to shape your research analyses.
1. Image Alignment
Images for each light band are taken by individual sensors. That means they don’t align perfectly when overlaid and must be co-registered.
2. Variable Lighting
Lighting conditions can significantly skew mapped values like NDVI potentially misleading conclusions or nullifying comparisons between flights or locations. Essential for accuracy, reflectance calibrations should be included with every flight upload.
3. File Size
Multispectral sensors generate 5 - 10 images at every capture which generates massive amounts of data. (A single flight can render 10-20 GB of imagery, or even more.)
Processing this volume of data requires significant computing power and connectivity, which is why field-edge processing can be painfully sloooow. And once processed, sharing or collaborating on large image files can be clumsy.
4. Evolving Sensor Technology
The white-hot drone imaging industry is constantly up-leveling technology with features that can require specialized handling. Newer panchromatic band sensors, like MicaSense’s RedEdge-P and Altum-PT, require additional raster calculations in GIS software like QGIS or ArcGIS.
5. Imagery & Analytics Software
Not all drone imagery software is alike. Some platforms are limited to specific sensors, require desktop downloads, or only function at the field edge. And some only offer image processing without analytics.
If you’ve invested in high-tech sensors, you’ll want to make sure your backend processing is equally matched. Choosing the right image processing and analytics partner is fundamental to your data quality and reliability. Everything downstream depends on it.
But you don’t need to become an imaging expert. At Solvi, we process thousands of multispectral datasets every year and our processing algorithms are validated and fine-tuned to yield consistent results every time.

Download The Drone Crop Scouting Schedule™ for FREE
Learn when to fly a field for actionable decisions and peak profits
Get your free pdfQuickly and Accurately Process MicaSense Multispectral Imagery with Solvi
Solvi’s automated workflow makes it quick and easy to process multispectral datasets of virtually any size in a few simple steps:
1. Select and preview your imagery before upload
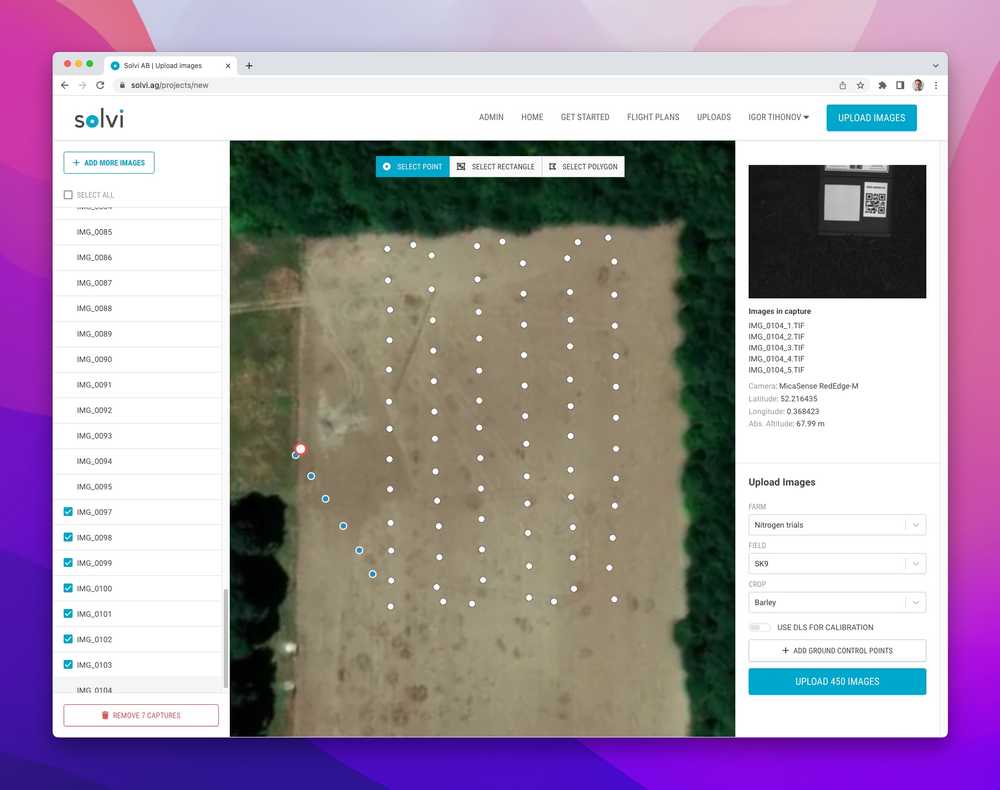
Solvi’s upload tool shows a preview of where the images were taken, providing a double-check that you’re working with the right files. (Much easier than browsing thousands of files on a hard disk!)
You can also remove unwanted images that may comprise dataset quality - like images at take-off or landing, or in transit to the starting point when the drone’s higher speed may blur or be off-target altitude.
2. Use a calibration tool (or two)
Reflectance Panels (Sunny day option)
Most manufacturers, including MicaSense, recommend collecting calibration images before and after each flight. Solvi detects these images in processing and uses the extracted data to automatically calibrate the imagery.
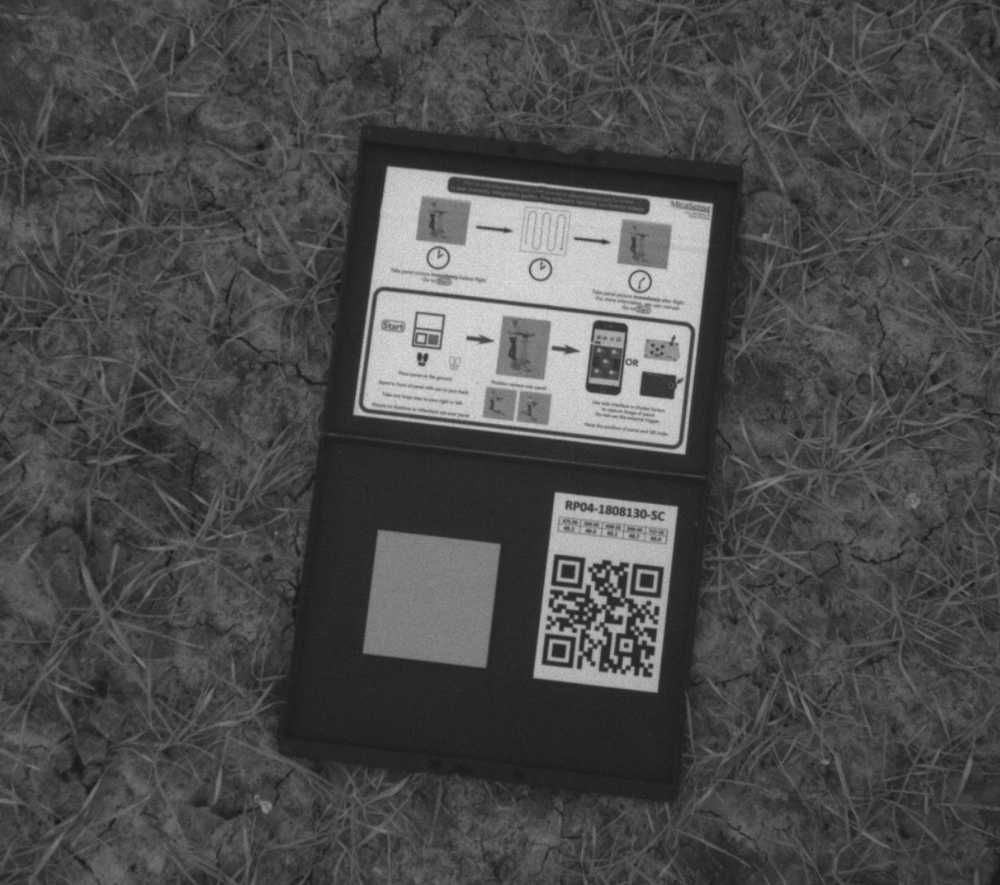
Calibration reflectance panels usually come with sensors but can also be purchased separately if lost or damaged. Because this step affects all resulting data, make it a regular part of your drone flight protocol – no matter who pilots.
Sensor Metadata (Cloudy day option)
If lighting vary during a flight (from overcast conditions), it’s beneficial to use sunshine sensor data (downwelling light sensor or DLS) in addition to reflectance panel images. But it’s not a set-it-and-forget-it option. In full sun conditions, DLS data can actually cause errors. So knowing (and noting!) when to include DLS data in processing is vital.
Onboard the drone, DLS data is automatically embedded into every image you take. To include this data in imagery processing, Solvi lets users simply check a box at upload.
3. Enjoy hands-free processing
Now go! Once transferred to Solvi, your images are blissfully processed on autopilot. Different band images are coregistered, calibration panel images detected and integrated, and imagery stitched into a single cloud-hosted map. All while you enjoy a cup of coffee.
Worried about those additional raster calculations needed for panchromatic band sensors? No problem. Solvi performs this post-processing step automatically too.
4. Visualize, analyze and share results
Solvi maps multispectral imagery fast - in as little as 10-20 minutes for smaller datasets or under an hour for larger sets.
After processing, Solvi renders a visual RGB map for a quick visual inspection. But behind the scenes, there is a potent multi-band GeoTIFF raster poised for analysis. Want to look at the individual bands or use different combination to generate CIR imagery? No problem, it’s only two clicks away!
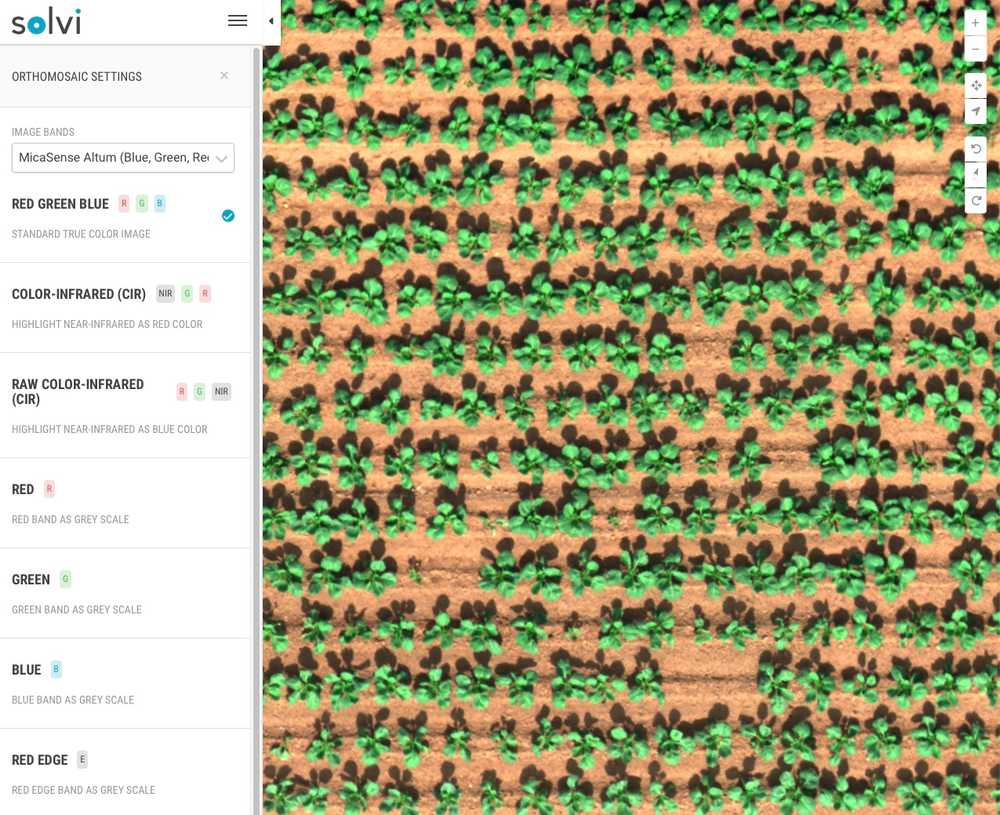
Multispectral users can investigate Plant Health maps based on vegetation indices like NDVI, NDRE, OSAVI from NIR and RedEdge bands, or calculate plot-level field trial statistics with Solvi’s Zonal Statistics tool.
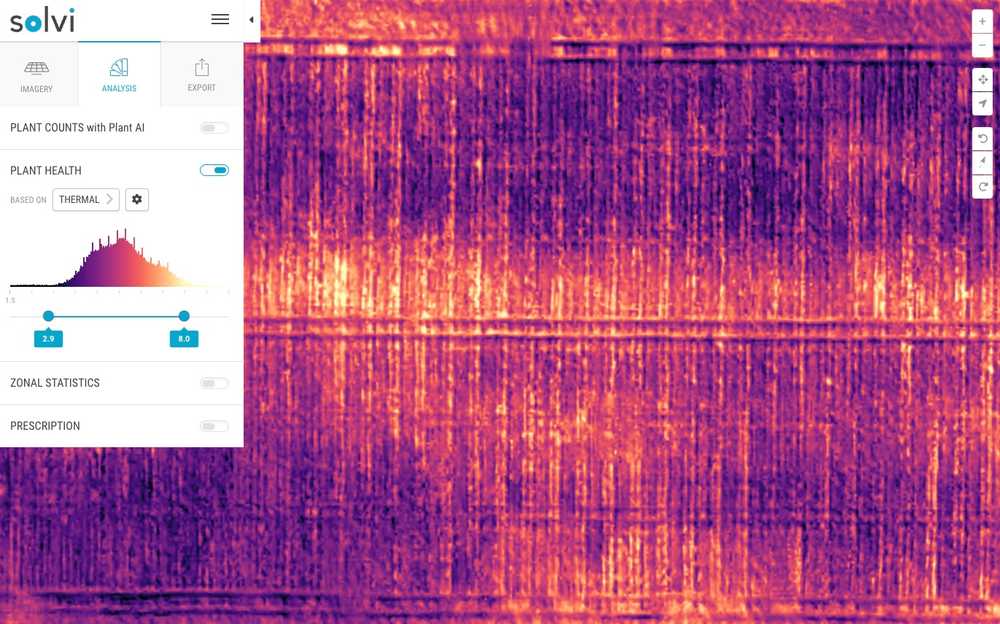
Have a thermal band sensor? Solvi translates raw thermal data into degrees celsius and maps a distinct color palette for easy visualization.
And if you’ve upgraded to a new panchromatic sensor, Solvi automatically pansharpens imagery for significantly higher resolution in precision plant counting and sizing.
Preserve Multispectral Data Quality With Solvi
Solvi simplifies complex multispectral image processing and data handling. With our easy image processing workflow, agricultural researchers can focus on interpreting their data rather than learning to process it.
The result? Enhanced data quality without a crash course in photogrammetry.
Leading breeding and research organizations including the Danish Technological Institute, Agrovista, Nordic Beet Research, the Swedish University of Agricultural Sciences and others use Solvi’s image-stitching and analytics tools to increase their data collection efficiency and accuracy.
Try your field imagery in Solvi for free today.
