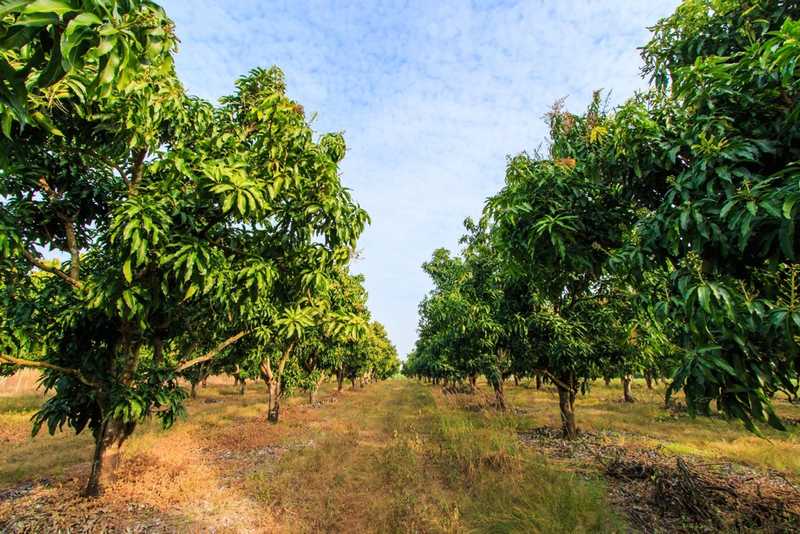
Establishing Management Zones For Irrigation Efficiency In Fruit Orchard
November 03, 2021
Luxelare, Mexico’s leading agricultural technology company, helped a Mexican mango grower decrease hydric tree stress by 18% during critical fruiting stages while reducing overall water consumption 50% by establishing unique management zones from Solvi’s drone analytics.
The grower approached us because of their interest in using technology,” said Julio López, agtech entrepreneur and former Luxelare CEO. “We saw the opportunity to improve the orchard’s performance and document the results for others to see the potential implications for their operations.
Details
Crop: Mango Trees (Kent, Keitt, Ataulfo, and Tommy Atkins varieties)
Location: Ahome, Sinaloa, Mexico (26.10, -109.21)
Farm size: 470 hectares
Soil type: sandy textured
Partners: Luxelare
Hardware: DJI P4 Multispectral drone, Arable Mark 2, Sentek soil probes, NO3 LAQUAtwin (nitrate ion meter)
Software: Solvi Plant Counts, Zonal Statistics, Elevation Maps, and Plant Health Maps
Flight Altitude: 150 m AGL(Above Ground Level)
Number of images: 3947
Image resolution: 7.6 cm/px
Processing time: < 24 hours
Situation
Jahuara de Mangos is a 470 HA mango orchard in Sinaloa, Mexico, growing four varieties across 48 subplots comprised of various aged trees. The location in Mexico’s western coastal region has arid sandy soil requiring frequent watering from a managed regional irrigation source.
Previously, the grower relied on manual overhead irrigation and was experiencing variable fruit yield across the orchard. The grower approached Luxelare and Solvi to help them use agricultural technology to improve orchard productivity.
Grower’s Goals
Optimize tree fruit production across the entire orchard through localized precision management.
Reduce water stress (estimated at an initial 30% deficit) which impacts tree canopy size and fruit yield.
Assessment Strategy
Luxelare reviewed satellite data for an initial land assessment but found the low resolution to be of little analytical value.
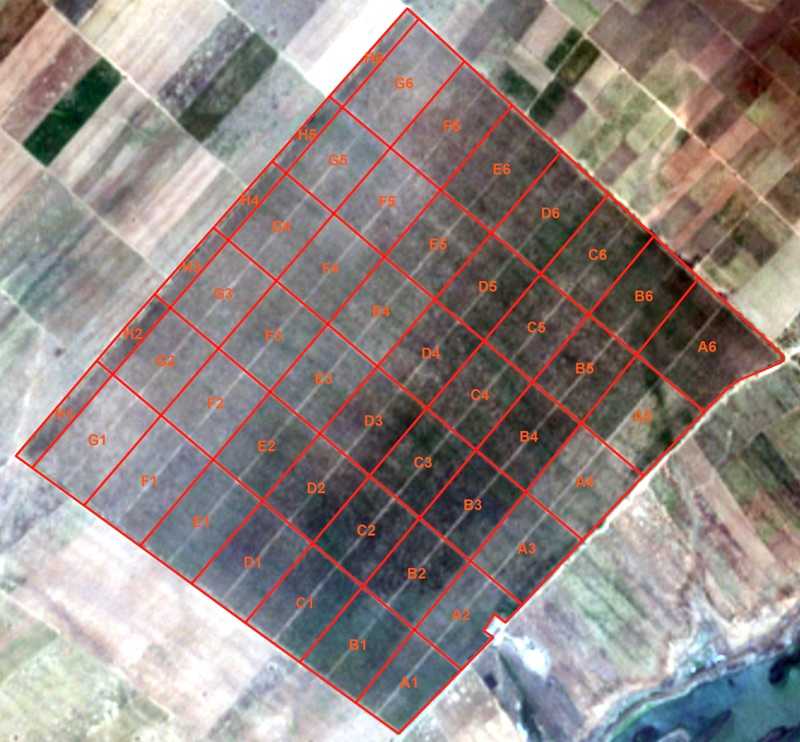
Subsequent drone surveys rendered detailed maps and valuable imagery analysis that revealed zones of similar management needs.
Drone Data Visualizations
1. Digital elevation map
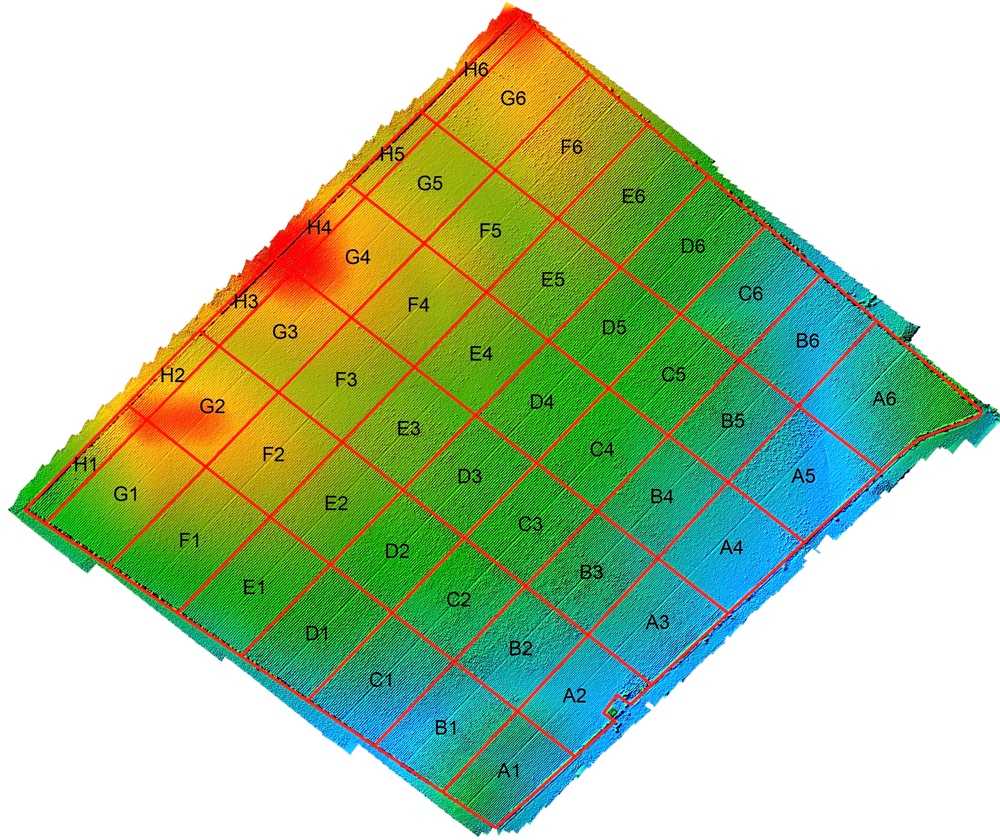
Luxelare drone-mapped the orchard and used Solvi’s analytics to create a digital elevation model exposing functional hydrodynamic characteristics.
The topographical map specifically identified two depressions that formed natural water paths through orchard subplots and three elevation areas indicating natural soil erosion and runoff pathways.
These ground conditions illustrated the overall water flow and directed further investigation of localized soil characteristics.
2. Tree count
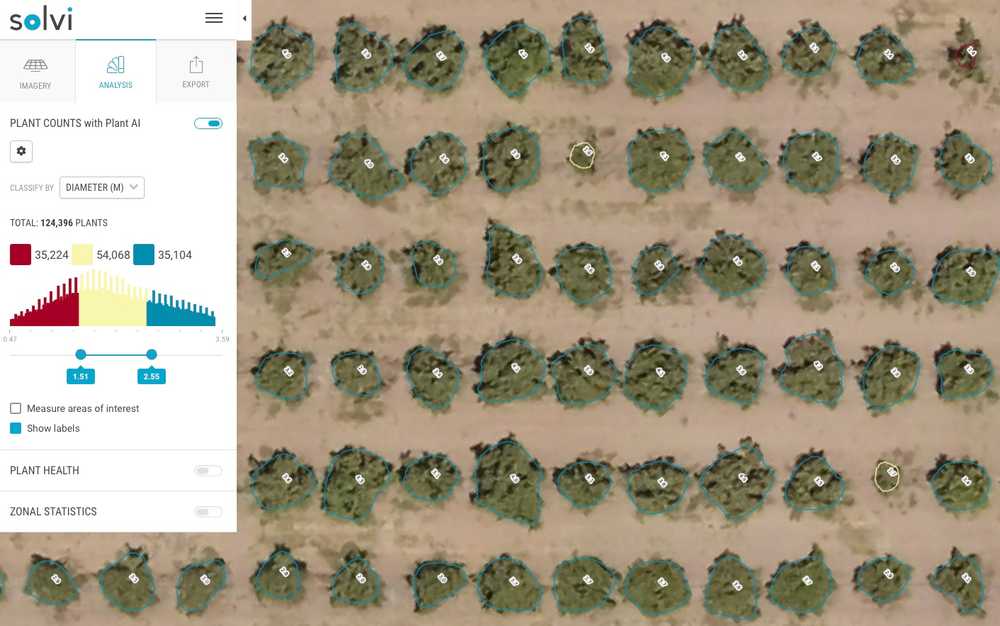
A complete orchard inventory from Solvi’s Plant Counts feature provided an exact count of all 124,396 trees and created a visual map of the orchard’s 48 subplots.
The overall count created a baseline tree inventory for tracking, land planning, valuation and crop insurance documentation.
Counts also indicate localized tree density. Fully planted subplots can be targeted for crop protection and pruning while sparsely planted plots are quickly identified for seasonal replanting.
3. Comparative canopy size measurements
Solvi’s Plant AI™ algorithm measured and compared tree crown diameters to group the trees into three common classes visually:
- Red = crown diameter <1.5m
- Yellow = 1.51m - 2.54m
- Blue = diameters 2.55m+
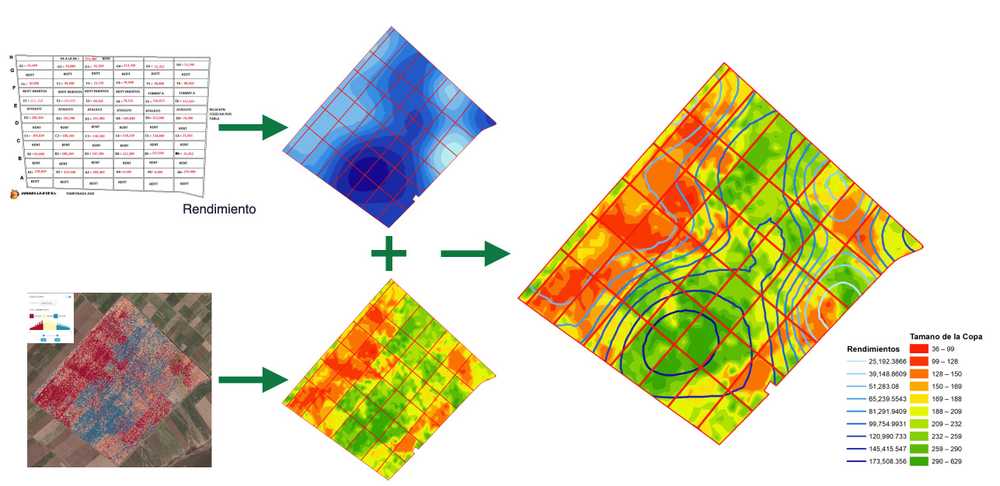
Solvi’s tree crown size groupings directly correlated to areas of similar topography and soil characteristics from the elevation map.
Download The Drone Crop Scouting Schedule™ for FREE
Learn when to fly a field for actionable decisions and peak profits
Get your free pdf4. Vegetation Index Map
Data showed that a tree chlorophyll index (or similar vegetation index) was inversely correlated with evapotranspiration readings. Higher evaporation rates coincided with lower plant chlorophyll production, which represented the extent of plant water stress. The orchard initially registered an average 30% water deficit.
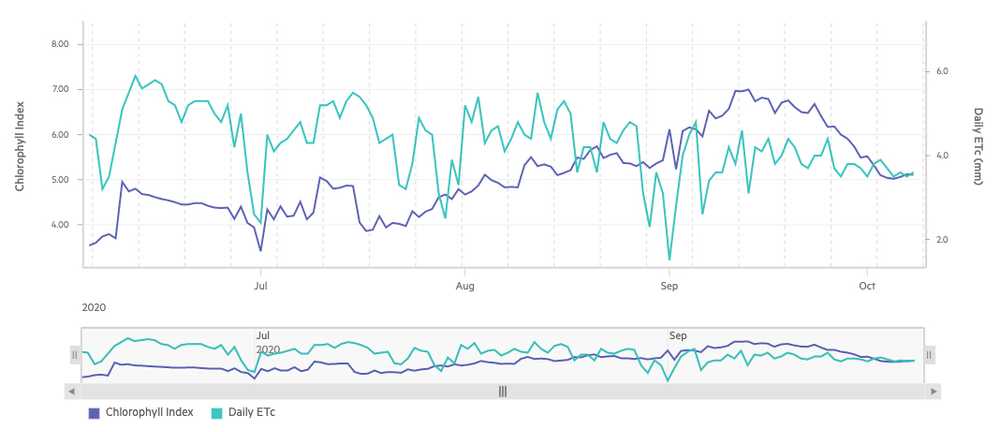
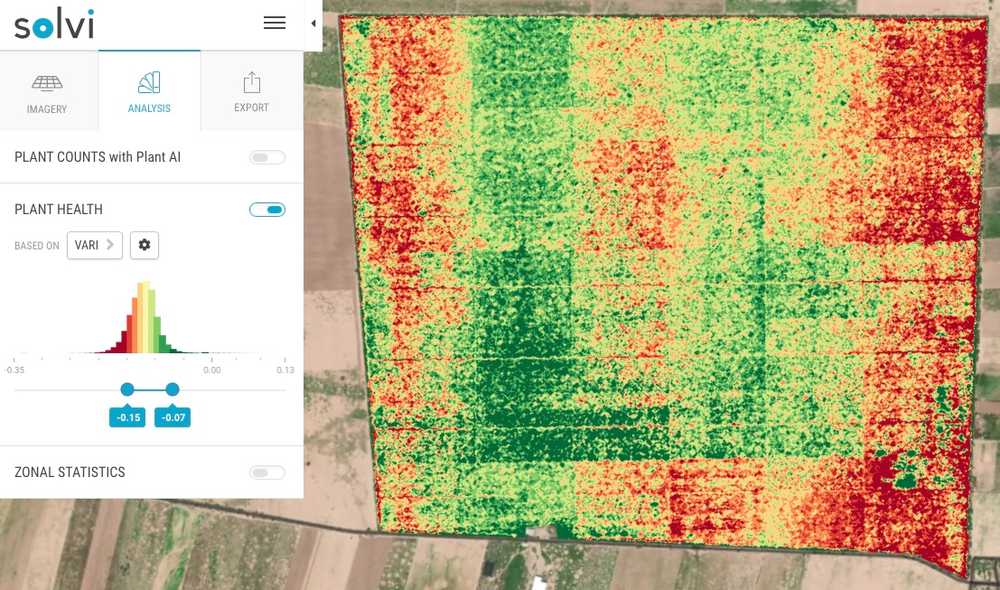
Water stress zones occurred as expected not only in irrigation runoff and low infiltration areas, but also in the young tree plots. Water requirements of mango trees are closely related to the tree’s age; young trees require more water than mature trees.
5. Zonal Statistics
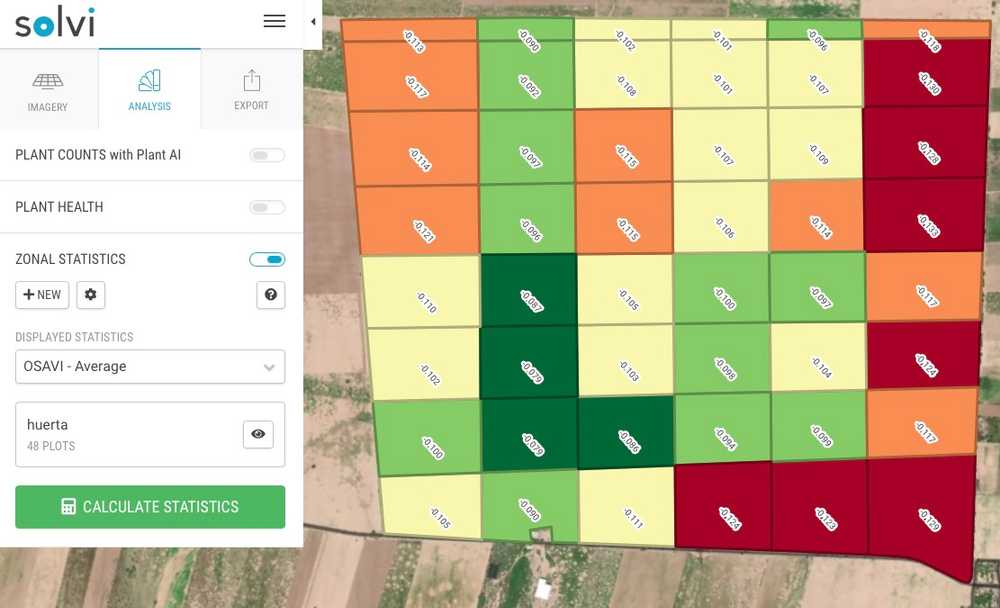
Because monitored soil probes were cost-prohibitive to place in every subplot, Luxelare derived evapotranspiration levels from the Normalized Difference Vegetation Index (NDVI) to assess water use and demand from each plot.
Solvi’s Zonal Statistics generated an at-a-glance subplot performance map. Luxelare ranked the plots according to the Optimized Soil Adjusted Vegetation Index (OSAVI) and tree canopy area. This hierarchy allowed them to determine localized water needs and accurately tailor a precise irrigation plan across the entire orchard.
Data Insights
Luxelare worked with the grower to establish three unique management zones based on common soil and performance characteristics. In low-performing zones, they further investigated soil moisture and electrical conductivity variations) with additional sensors.
In-ground moisture probes assessed water infiltration (VWC%) and evaporative transpiration (ETc %) to calculate and tailor irrigation needs for each management zone.
Pocket nitrate ion meters were used to measure electrical conductivity for fertilization (N) adaptation. Researchers found a linear correlation between chlorophyll index (also available by drone vegetation index) and soil electrical conductivity.
Management Changes
The grower adjusted orchard irrigation timing based on unique needs within each zone:
- Reduced irrigation by one hour where water infiltration was highest.
- Increased irrigation by two hours where infiltration was low.
- Net 50% water savings.
Luxelare recommended establishing cover crops beginning in low water infiltration areas to increase soil moisture retention.
To optimize nitrogen use, the grower and Luxelare adapted the tree fertilization schedule based on tree chlorophyll index and soil electrical conductivity (nitrogen content) probe measurements.
Outcomes
- Average tree hydric stress decreased 18% during the year, mostly in crucial fruit production stages.
- Overall water use decreased by 50% by adapting irrigation duration to zonal needs.
- The grower established a predictable irrigation schedule that would allow them to implement an automated system, reducing labor hours and increasing efficiency.
Future Plans
Drone survey and analytics provided the grower with a new data-backed quantitative perspective on the orchard layout and structure, which will guide localized precision management decisions.
The drone analytics process proved so simple and effective that the grower committed to continuing drone surveys and personally purchased his own drone to pilot flights. The grower plans to conduct drone surveys after crop development activities (post-pruning, before flowering) to evaluate performance and guide future management decisions. The grower will continue to use Solvi for drone analytics processing.
Benefits of Solvi Analytics
Because of Solvi’s cloud-based processing, Luxelare could process field imagery and analytics offsite in one step. (No field connectivity was available.)
- All in one cloud-based platform. No 3rd party software needed.
- Works with any RGB or multispectral camera and drone combination.
- Simple four-step imagery upload process.
- Highly accurate plant counts, per-plant measurements, and health analytics.
- Clear, visual maps and data results for grower reports.
- Quick 24-48 hours turnaround time.
The results from this project were outstanding. The tree (and grower’s) response to our management changes was greater than expected,” López said. “The combination of agricultural technologies allowed us to investigate broadly and then target our interests for a precision approach backed by sound data. Overlapping digital agriculture datasets in this way provides crystal clear insights that propel our strategic recommendations.
