3 Ways to Extract Research Plot Boundaries from Agricultural Drone Imagery
March 10, 2022
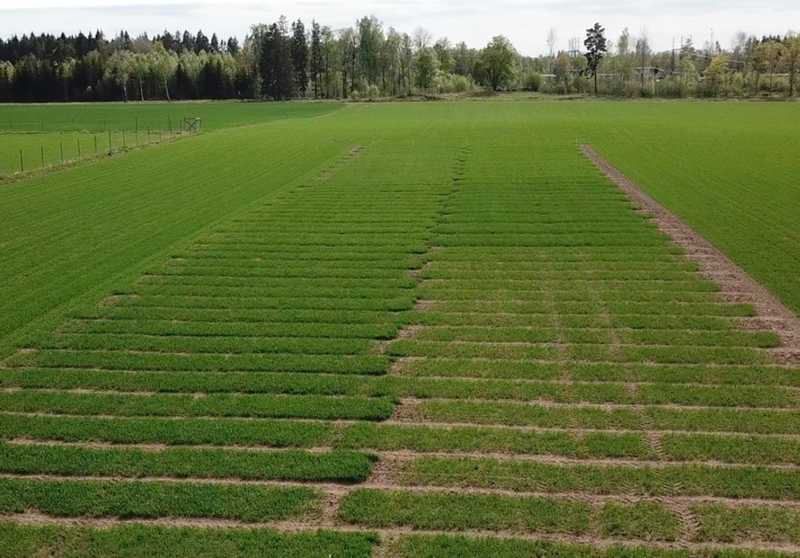
Agricultural researchers and plant breeders must assess their field trials on a regular basis; however, manually documenting research plot observations is time-consuming, highly subjective, and usually relies on a limited field sample. Even the most conscientious researcher is bound by limits of time and human error. In an industry where precision matters, uncontrolled data variables can wreak havoc on outcomes. Overlooked or unexplained anomalies gnaw away at your data confidence and conclusions.
Drone Imagery Simplifies Research Trial Inspections
Drone technology simplifies and objectifies field trial assessments. A 15-20 minute hands-free drone flight covers most field trials and captures a highly accurate, data-rich image of each plot. Now, objective field observations can be documented and analyzed from anywhere by anyone – if you can extract plot-level data.
Raw drone imagery is a potent, unmined resource. But do-it-yourself image processing requires multiple GIS tools and complicated programming to generate plots and render analytical data — time and skills you may not have (or want to spare). Imagery alone doesn’t yield the valuable statistics you need – but Solvi’s Zonal Statistics does.
Solvi streamlines the process of creating research plot boundaries with a simple user interface to visually create plot boundaries, quickly render statistics, and export results, all with a few clicks. Now you can focus on advancing your research, not your programming skills.
Three Ways to Create Research Plot Boundaries
Upload your drone imagery (RGB, multispectral, or thermal) and Solvi’s Zonal Statistics offers three ways to easily create your research plot boundaries:
1. Import plots from a SHP- or KML-files
If you’ve predefined your plots in other software, just upload your SHP- or KML-file and see it instantly overlapped with your field imagery. This option is best suited to large research programs with advanced study designs and dedicated programming resources.
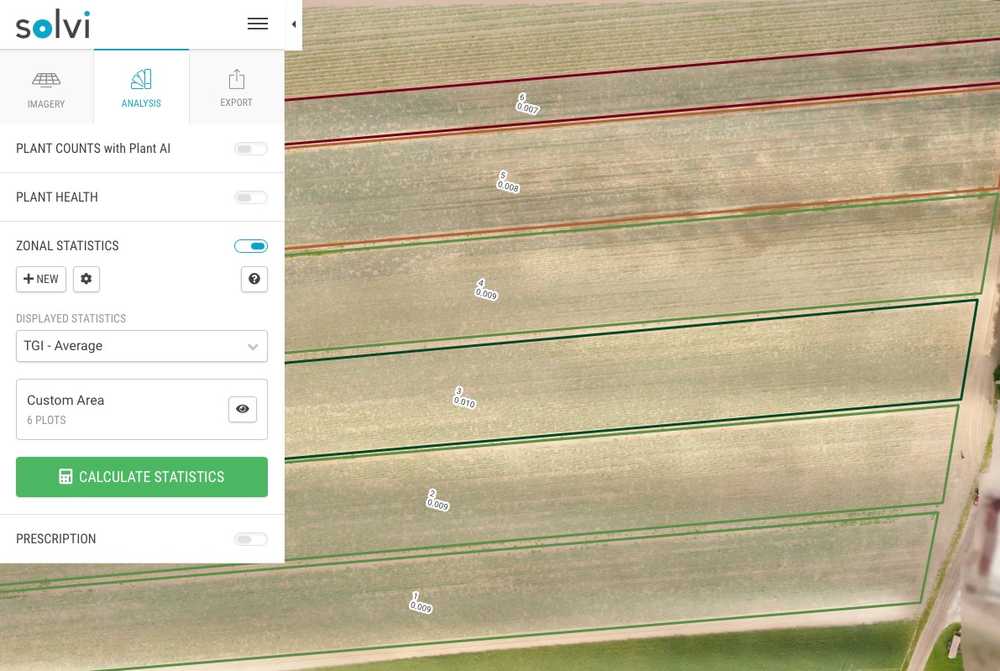
2. Draw custom zones
Another option is to click and draw polygons around individual plots in any size or shape. Once drawn, the polygons can be easily copy-pasted, resized, rotated etc. using tools in the editing toolbar. This feature can be used to analyze a full field or to highlight a specific portion of a research field. It’s also a great option for small or unusually sized field plots.
3. Automate Boundaries Extraction with Trial Plot Tools
Have a lot of trial or numerous plots to mark? Speed your field plot creation with automation! Trial Plot Tools offers two methods to quickly create large numbers of field plots regardless of crop growth stage.
Auto-Detect Plots Tool
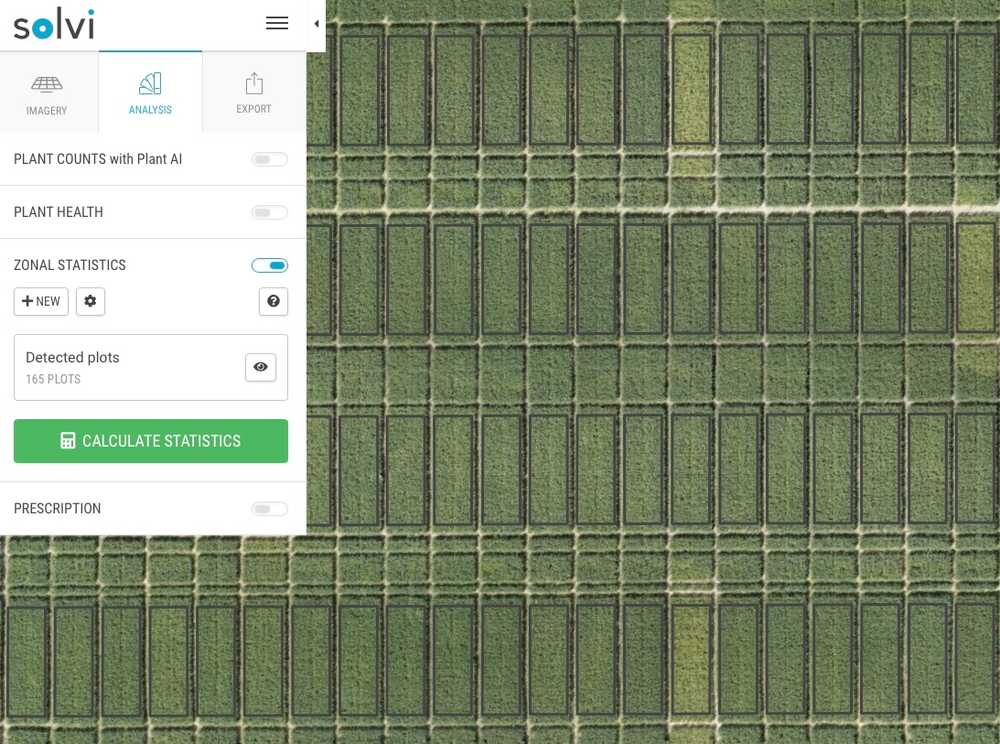
In fields with clearly defined plots, you can sit back and let Solvi’s AI algorithm smartly detect plot boundaries. Simply outline the entire field and the individual plots are automatically extracted.
This works best for established crops with clear gaps between plots. If your plot boundaries aren’t obvious, like in newly emerged crops or those with dense canopies (like sugar beets), Solvi’s Generate Plots tool may provide better results.
Generate Plots Tool
For difficult to detect areas, Solvi’s Generate Plots tool allows users to define a plot template to match their research field. Input the number of plot rows and columns in your field along with the dimensions of each plot and Solvi returns a block template. You can easily adjust, rotate, and scale the template to accurately match your field image.
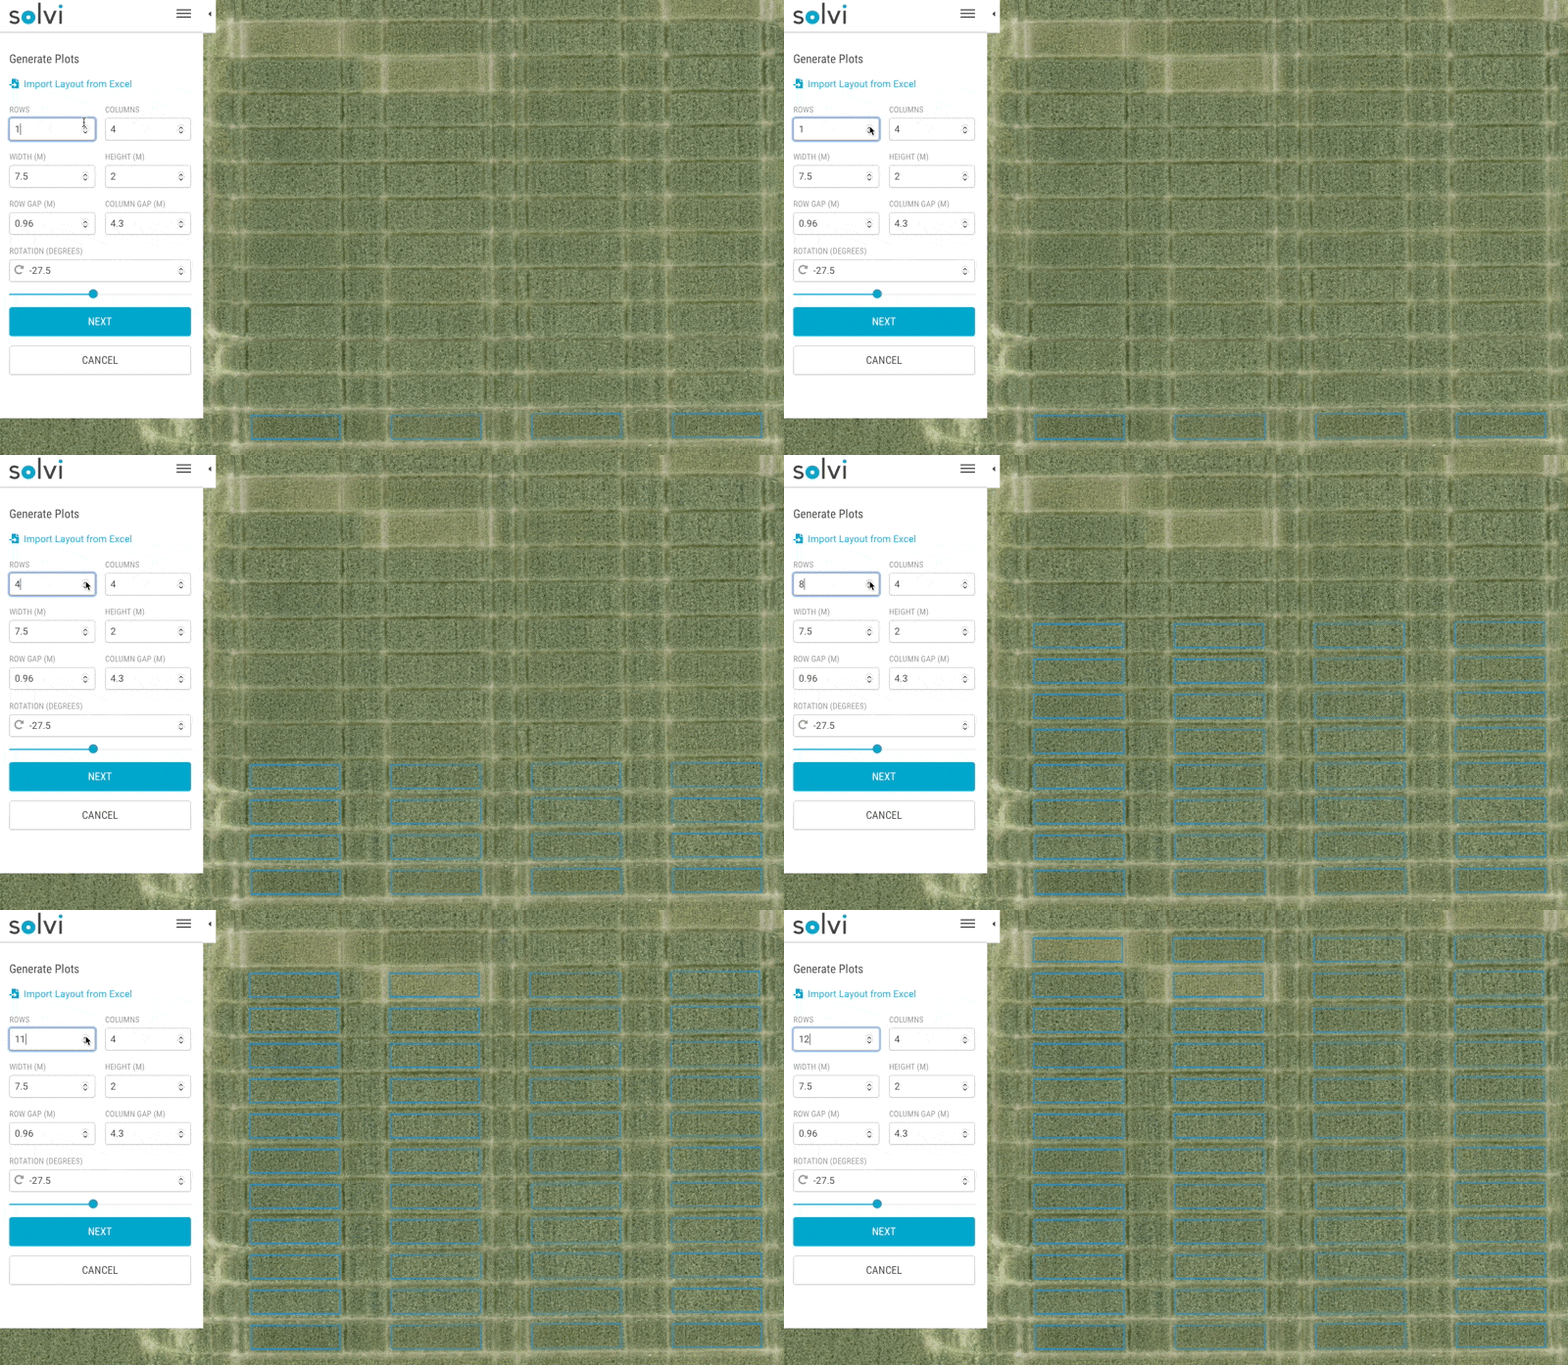
No matter which method you use to create plots, you’ll always have access to an editing toolbar that allows you to fine-tune plot sizes and gaps to exactly match your field layout. Select, duplicate, resize, delete, and even merge plots until the design is precisely, uniquely yours.
Create your plots once and the layout can be copied to future images throughout the growing season.
Custom Label and Number Research Plots
After outlining your plots, Solvi auto-numbers each plot in the field for reference. Then you can customize numbering to start and sequence in any direction. Choose a row/column index, a sequential snaking or zigzag pattern, or your own proprietary numbering system from an Excel template.
Notice an issue? Once the labeling is created, users can always revisit the layout to edit and make adjustments as necessary.
Let The Analytics Begin
With your plots outlined and labeled, you’re ready to unleash the power of Solvi’s pixel-level statistics. With one click you can immediately visualize vegetation indices, elevation, crop height, and even plant counts and sizing for every plot. It’s an instant-read dashboard of your entire research field.
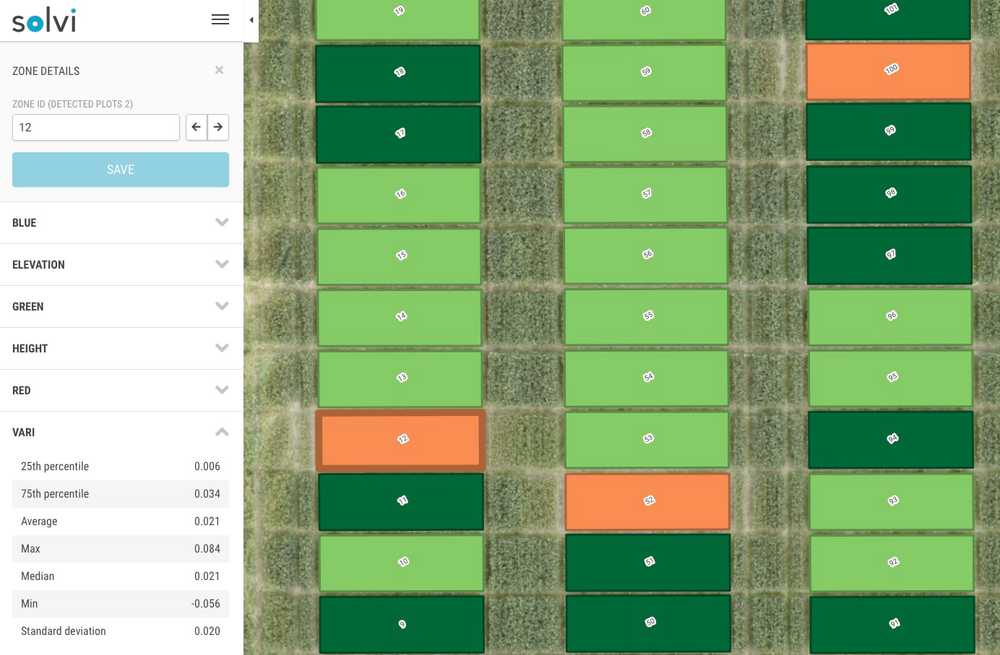
If you need to dive deeper or share your data, all stats can be exported in either an SHP or CSV file.
Research Plot Statistics Pricing
Pictures are said to be worth a thousand words, but accurate and effortless research observations are priceless!
Solvi users on our Agronomist (or higher) plans already have Import and Custom Zones features included. Need automation? Solvi’s Trial Plot Tools are available for Enterprise users or as an add-on to any package tier. Try it today!
Simplify Research Plot Assessments with Solvi
Leading breeding and research organizations including Rijk Zwaan, Agrovista, Nordic Beet Research, the Swedish University of Agricultural Sciences and others use Zonal Statistics tools to increase their data collection efficiency and accuracy.
With Zonal Statistics these researchers now spend less time on mundane tasks like extracting plot-level data and now dedicate more time to actual research. The result? Improved trial data quality in less time.
We have expanded our data management and analysis systems to incorporate the results of data analysis in Solvi. And it has allowed us to overlay our trial outcomes and get fantastic visuals of the results
- William English, Project Manager & Industrial Doctoral Candidate at Nordic Beet Research
Increase your crop research data confidence with Solvi. Start your free trial today.
